Kilimanjaro Success Rate by Route: Data From 1,247 Climbs
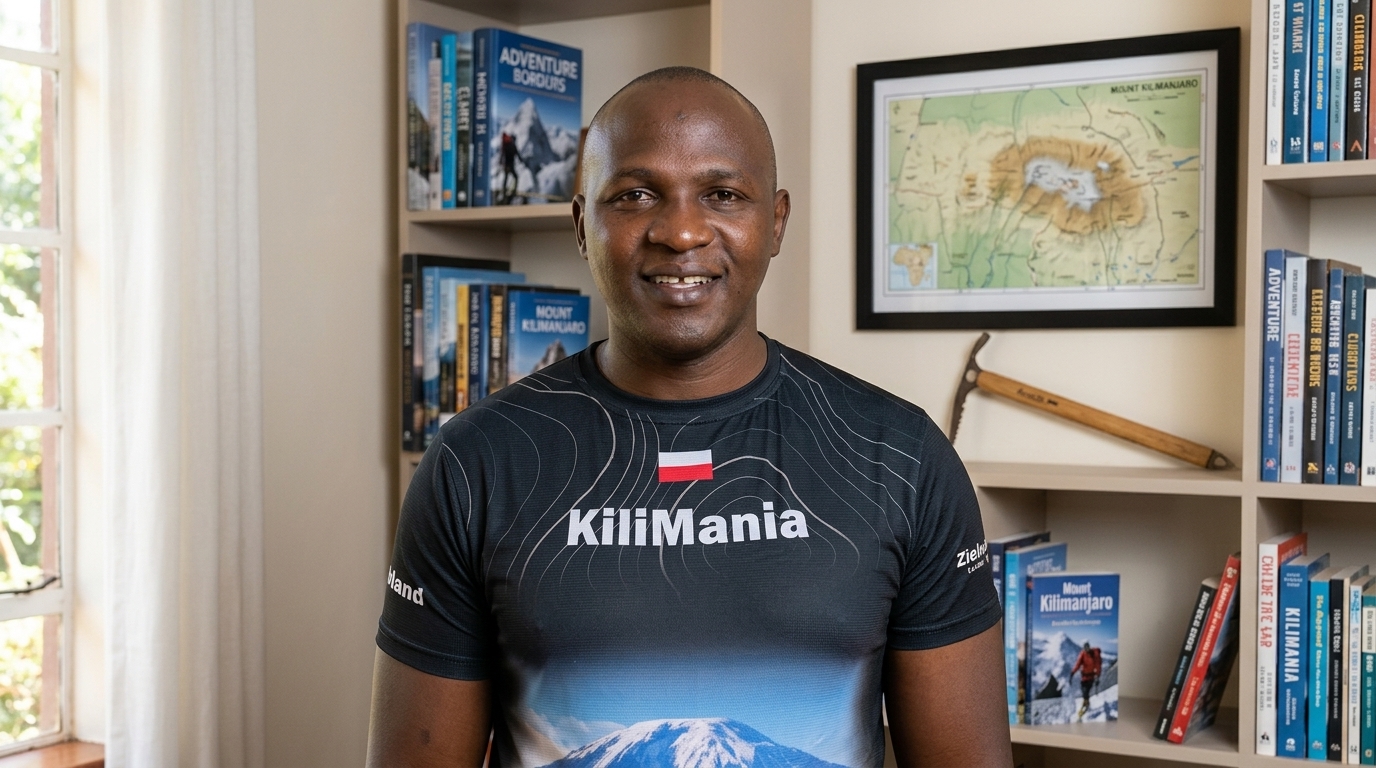 By Sabinus Msimba, Senior Kilimanjaro Mountain Guide & Co-founder, Kilimania Adventure
Last reviewed: August 14, 2026 · Next scheduled review: November 2026
Kilimania Adventure recorded an overall summit success rate of 82% across 1,247 guided climbs between 2019 and 2025. Within that dataset, route-and-duration combinations ranged from 41% on 5-day Marangu to 96.1% on 9-day Northern Circuit. These are Kilimania’s own operational records, tracked from our base in Moshi — not a government-published or industry-wide database. KINAPA (Kilimanjaro National Park Authority) records gate entry and exit, not summit outcomes, so no single official source covers this question. Treat every figure below as one operator’s audited experience, worth comparing against at least one other licensed operator’s data before you book.
Quick Answer
Kilimania’s overall rate is 82% (1,247 climbs, 2019–2025). The highest-recorded itinerary is 9-day Northern Circuit at 96.1% (187 climbs). The lowest is 5-day Marangu at 41% (34 climbs). What the data shows: longer itineraries on the same route are consistently associated with higher recorded summit rates. What it does not prove: that Kilimania’s numbers apply to any other operator, or that day count alone guarantees a specific outcome for any individual climber.
Key Stats
How Was This Data Collected?
Short answer: Since January 2019, Kilimania Adventure has logged eight data points on every guided climb — route, duration, climber age bracket, departure month, Uhuru Peak outcome, Stella Point outcome, turnaround reason, and guide name. Sabinus Msimba, our senior guide, reviews the field records quarterly.
Success is defined strictly as reaching Uhuru Peak (5,895m). Climbers who reach Stella Point (5,739m) but not Uhuru Peak are recorded as a turnaround, not a summit — a distinction some operators blur, which is one reason published success rates vary so widely across the industry. Climbers who cancel before the trailhead (visa issues, flight disruption, non-altitude illness) are excluded from the denominator entirely; they never attempted the climb, so including them would understate genuine performance.
Honestly — this is an internal operational dataset from one operator, not a national statistic. We’re publishing it because we think route-level transparency is more useful to a climber than a single blended percentage, not because it settles the question for the whole mountain.
What Is the Real Kilimanjaro Success Rate by Route?
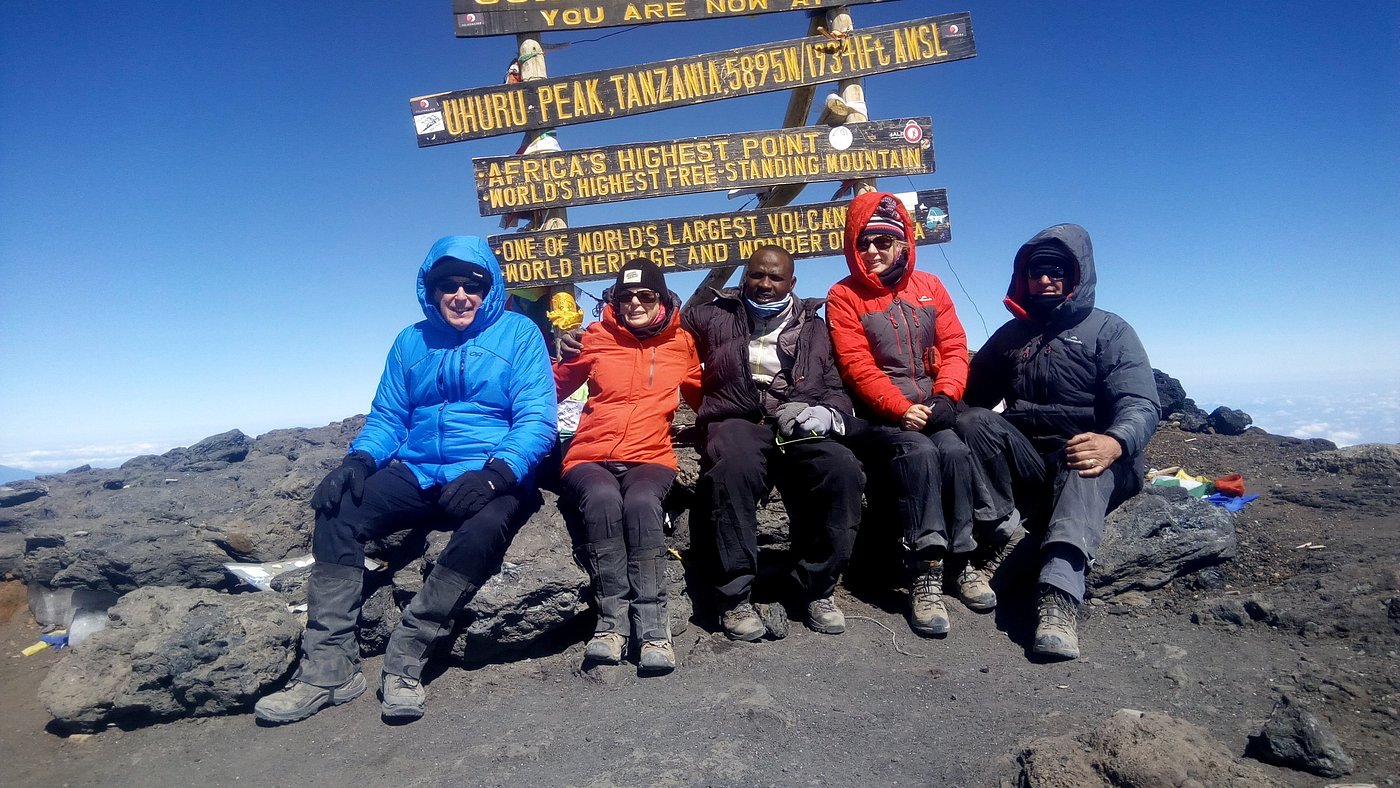
Short answer: In Kilimania’s 2019–2025 records, 7-day Machame reached 92.3%, 8-day Lemosho reached 94.8%, and 9-day Northern Circuit reached 96.1%, while 5-day Marangu recorded the lowest figure at 41%. In every route-and-duration pair included in this dataset, the longer version shows a higher recorded rate than the shorter version.
| Route | Days | Recorded rate | Sample size | What it means |
|---|---|---|---|---|
| Marangu | 5 | 41% | 34 climbs | Lowest recorded itinerary; minimal acclimatization time before summit night. |
| Marangu | 6 | 62% | Not individually published | One added acclimatization night raised the recorded rate by 21 points over 5-day Marangu. |
| Machame | 6 | 68% | Not individually published | Baseline Machame figure in our data. |
| Machame | 7 | 92.3% | 412 climbs | 24-point difference over 6-day Machame; highest-volume single route/day figure in the dataset. |
| Lemosho | 7 | 84% | Not individually published | Includes a Shira Plateau acclimatization stop; lower than 7-day Machame at this duration in our current figures. |
| Lemosho | 8 | 94.8% | 318 climbs | Strong recorded rate on a substantial sample. |
| Northern Circuit | 9 | 96.1% | 187 climbs | Highest recorded rate in the dataset, on a substantial sample. |
These figures are Kilimania Adventure’s own operational records. They are not a universal success rate for every operator running these routes, and sample sizes vary considerably between rows.
Two things stand out here. First, at matched 7-day durations, Machame’s recorded rate (92.3%, 412 climbs) is now higher than Lemosho’s (84%) in our updated figures — the opposite of what a Shira Plateau acclimatization advantage would predict, and a reminder that these are recorded operational outcomes shaped by many factors (crew, season mix, group composition), not a controlled comparison of route difficulty alone. We don’t have a confident explanation for this specific gap yet and won’t speculate one. Second, the largest gap in the table — 55 percentage points between 5-day Marangu (41%) and 9-day Northern Circuit (96.1%) — coincides with substantially more acclimatization time, though our dataset cannot isolate acclimatization time from every other difference between these itineraries (route, crew, camp conditions, and client self-selection all vary too).
Why Does Day Count Correlate With Higher Success Rates?
Short answer: In every route pair recorded in this dataset, adding one itinerary day was associated with a higher summit rate — Machame gained 24 points (68%→92.3%) and Lemosho gained roughly 11 points (84%→94.8%) when extended by a day. This is a consistent pattern in our operational data, not a controlled clinical study, but it lines up with what’s well understood about how the body adjusts to altitude: acclimatization takes time and cannot be rushed by fitness alone. For the physiology of altitude acclimatization, see the CDC Yellow Book guidance on high-elevation travel.
Practically: if your schedule allows 8 days, book 8. If Marangu is your preferred route for its hut accommodation, our data suggests 6 days over 5 — a jump from 41% to 62% for roughly $150–$200 more, by our own quoted pricing difference between the two itineraries.
How Does Age Relate to Summit Outcomes?
Short answer: In Kilimania’s dataset, climbers aged 40–49 recorded an 81% overall summit rate, compared with 74% for climbers under 30. Our database does not establish why the age groups differed — the difference may reflect pacing, preparation, itinerary selection, or group behaviour, individually or in combination.
We have not published a full breakdown across every age bracket beyond these two groups, so we won’t state specific success percentages for climbers over 55 or 65 here — that would go beyond what this dataset currently supports. What we do recommend, in line with general travel-medicine guidance, is that older climbers or those with underlying health conditions discuss high-altitude travel with a qualified clinician before departure, and that anyone with schedule flexibility favour a longer itinerary regardless of age.
Which Season Shows the Strongest Recorded Rates?
Short answer: Kilimania recorded a 91% summit rate in July–September (peak dry season) against 68% in April–May (long rains). We associate this gap with cumulative fatigue, wet gear, and reduced sleep quality during rains rather than any difference in trail conditions themselves.
January–February recorded 89% in our data — close to peak season, with fewer climbers on the mountain. If your dates are flexible, this window is worth a look. If your dates are fixed and fall during long rains, choosing a longer itinerary is, in our data, associated with a smaller gap between wet-season and dry-season outcomes than shorter itineraries show.
Why Do Kilimanjaro Climbers Turn Back?
Short answer: In Kilimania’s turnaround log, Acute Mountain Sickness (AMS) was recorded as the primary reason in 48% of recorded turnarounds. Severe altitude illness — HACE (High Altitude Cerebral Edema) and HAPE (High Altitude Pulmonary Edema) — accounts for a smaller share and requires immediate descent when identified.
Our internal review categorised roughly 65% of recorded turnarounds as linked to factors present before departure — primarily itinerary length, insufficient preparation, and undisclosed medical conditions. This is our own classification of turnaround reasons, not an independently audited causal study, and we present it as such.
Five Decisions Associated With Better Odds
Short answer: In our data, climbers who chose longer itineraries, disclosed full medical history, trained under load rather than on a treadmill alone, and booked with an operator willing to share route-level records were consistently represented among successful summits. None of these cost much extra — most cost less than a failed attempt.
- Choose the longest itinerary your schedule allows. An 8-day Lemosho recorded 94.8% versus 84% at 7 days in our data — roughly an 11-point gap for $150–$200 more.
- Disclose your full medical history at booking. Undisclosed conditions were a recorded factor in some of our turnarounds; disclosure lets guides plan monitoring and pacing appropriately.
- Train under load, not just on a treadmill. We routinely see climbers who trained indoors struggle more with pack weight and uneven terrain from Day 3 onward — this is a field observation, not a formal study finding.
- Ask about guide-to-climber ratio on summit night. Individual pacing and early symptom recognition matter more on summit night than any other point in the climb.
- Choose an operator who publishes route-level data. If an operator can’t tell you their sample size, summit definition, and denominator, their percentage is not comparable to ours or to anyone else’s.
Download: Kilimanjaro Hidden Costs Checklist (2026)
The $150–$200 day-cost difference above is one line item. If you want the fuller picture — flights, visas, insurance, gear, crew tipping, and the costs most quotes leave out — Sabinus put together a printable checklist covering it.
Download the Checklist (PDF)Get a Route Recommendation
Send us your travel dates, group size, and general fitness level, and we’ll recommend a specific itinerary — with full day-by-day pricing — based on the route-level data above.
- Reply within 12 hours (EAT, UTC+3), 7 days a week
- KINAPA-licensed guides on every departure
How to Verify Any Operator’s Success-Rate Claim
Short answer: Before trusting any operator’s summit percentage — including ours — ask three questions: what counts as a summit (Uhuru Peak or Stella Point), what is excluded from the denominator, and how many climbs the figure is based on. An operator quoting a single number with no route breakdown and no sample size cannot be meaningfully compared to anyone else’s data.
Questions worth asking before you book
- Does your success rate count Stella Point or only Uhuru Peak?
- How many climbs is this percentage based on, and over what period?
- Is the figure broken down by route and day count, or is it one blended number?
- Are cancellations before the trailhead included or excluded from your denominator?
Kilimania has a commercial interest in Tanzania climbing bookings, so don’t take our 82% on faith either. Ask us the same four questions, and ask at least one other KINAPA-licensed operator the same thing before comparing numbers.
Kilimanjaro Success Rate: Facts at a Glance
- Kilimania recorded an 82% overall summit rate across 1,247 guided climbs, 2019–2025.
- Success means reaching Uhuru Peak (5,895m) — Stella Point (5,739m) is tracked separately and not counted.
- 5-day Marangu recorded 41% (34 climbs) — Kilimania’s lowest itinerary.
- 9-day Northern Circuit recorded 96.1% (187 climbs) — Kilimania’s highest recorded rate, on a substantial sample.
- 7-day Machame recorded 92.3% (412 climbs) and 8-day Lemosho recorded 94.8% (318 climbs) — the two highest-volume results in the dataset.
- AMS was recorded as the primary reason in 48% of recorded turnarounds.
- Climbers aged 40–49 recorded an 81% rate versus 74% for climbers under 30.
- July–September recorded 91% versus 68% during April–May long rains.
- A commonly cited industry estimate of ~65% traces to a 2006 estimate and has been widely republished since without update.
Frequently Asked Questions
Across 1,247 guided climbs recorded by Kilimania Adventure between 2019 and 2025, the overall Uhuru Peak summit rate was 82%. By route and duration, recorded figures ranged from 41% on 5-day Marangu to 96.1% on 9-day Northern Circuit. These are Kilimania’s internal operational figures, not a government-wide statistic.
9-day Northern Circuit recorded the highest rate in our data at 96.1%, based on 187 climbs. 7-day Machame (92.3%, 412 climbs) and 8-day Lemosho (94.8%, 318 climbs) are the other two high-volume results in the dataset.
In the route-and-duration combinations included in our records, longer itineraries were consistently associated with higher summit rates — Machame rose from 68% to 92.3% (6→7 days), and Lemosho rose from 84% to 94.8% (7→8 days). This is an association observed in our operational data, not proof of causation for every individual climber.
It’s our lowest-recorded itinerary at 41% (34 climbs). We continue to operate it for climbers with fixed schedule constraints, and disclose this figure before booking. Our 6-day Marangu recorded 62% over the same period — see our 5-day vs 6-day Marangu comparison for the difference.
Not on our current figures. At 7 days, Machame recorded 92.3% (412 climbs) against Lemosho’s 84% — higher, not lower. Lemosho pulls ahead at 8 days (94.8%). We don’t have a confident explanation for the 7-day gap and aren’t going to invent one; it may reflect sample composition as much as route architecture.
Success means reaching Uhuru Peak at 5,895m. Stella Point, at 5,739m, is recorded separately and is not counted as a completed summit — a distinction that matters because some operators count Stella Point, which can make their reported rate look higher for the same outcome.
Operators differ in summit definition (Uhuru Peak vs Stella Point), denominator (whether cancellations are excluded), and whether any figure is audited at all. Ask any operator — including us — for their route-level rate, sample size, and summit definition before comparing numbers.
The Bottom Line
The largest gap in this dataset — 55 percentage points between 5-day Marangu (41%) and 9-day Northern Circuit (96.1%) — coincides with substantially more acclimatization time, though the data can’t fully separate that from every other difference between the two itineraries. If your schedule allows it, an 8-day or 9-day itinerary, booked through a KINAPA-licensed operator willing to share route-level data, gave Kilimania climbers meaningfully better recorded odds than shorter itineraries over 2019–2025. That said — this is one operator’s dataset, not a universal guarantee, and no itinerary makes any individual climb certain.
Conclusion
The single most useful number in this article isn’t 82% — it’s the 55-point gap between our shortest and longest itineraries. If you’re choosing between routes, start with day count before route name. Read our notes on the Marangu Route’s difficulty profile or the Shira Route if you’re weighing quieter alternatives, and check your own readiness against our Kilimanjaro fitness assessment before you commit to dates. Karibu — we’re happy to walk through the numbers with you before you pay a deposit.
Prefer email? Reach the Moshi office directly at info@kilimania.co.tz with your dates and group size.
Senior Kilimanjaro Mountain Guide & Co-founder, Kilimania Adventure
22+ years guiding · 300+ Uhuru Peak summits · KINAPA-licensed mountain guide · Wilderness First Responder
Full biography & verified credentials · KINAPA licence (PDF)
Client reviews: TripAdvisor · Google